Even odder than finding that our old EnKF approach for parameter estimation was particularly well suited to the epidemiological problem, was finding that someone else had independently invented the same approach more recently…and had started using it for COVID-19 too!
In particular, this blogpost and the related paper, leads me to this 2013 paper wherein the authors develop a method for parameter estimation based on iterating the Kalman equations, which (as we had discovered back in in 2003) works much better than doing a single update step in many cases where the posterior is very small compared to the prior and the model is not quite perfectly linear – which is often the case in reality.
The basic idea behind it is the simple insight that if you have two observations of an unknown variable with independent Gaussian errors of magnitude e, this is formally equivalent to a single observation which takes the average value of the two obs, with an error of magnitude e/sqrt(2). This is easily shown by just multiplying the Gaussian likelihoods by hand. So conversely, you can split up a precise observation, with its associated narrow likelihood, into a pair of less precise observations, which have exactly the same joint likelihood but which can be assimilated sequentially in which case you use a broader likelihood, twice. In between the two assimilation steps you can integrate the model so as to bring the state back into balance with the parameters. It works better in practice because the smaller steps are more consistent with the linear assumptions that underpin the entire assimilation methodology.
This multiple data assimilation idea generalises to replacing one obs N(xo,e) with n obs of the form N(xo,e*sqrt(n)). And similarly for a whole vector of observations, with associated covariance matrix (typically just diagonal, but it doesn’t have to be). We can sequentially assimilate a lot of sets of imprecise obs in place of one precise set, and the true posterior is identical, but the multiple obs version often works better in practice due to generating smaller increments to the model/parameter samples and the ability to rebalance the model between each assimilation step.
Even back in 2003 we went one step further than this and realised that if you performed an ensemble inflation step between the assimilation steps, then by choosing the inflation and error scaling appropriately, you could create an algorithm that converged iteratively to the correct posterior and you could just keep going until it stopped wobbling about. This is particularly advantageous for small ensembles where a poor initial sample with bad covariances may give you no chance of reaching the true posterior under the simpler multiple data assimilation scheme.
I vaguely remembered seeing someone else had reinvented the same basic idea a few years ago and searching the deep recesses of my mind finds this paper here. It is a bit disappointing to not be cited by any of it, perhaps because we’d stopped using the method before they started….such is life. Also, the fields and applications were sufficiently different they might not have realised the methodological similarities. I suppose it’s such an obvious idea that it’s hardly surprising that others came up with it too.
Anyhow, back to this new paper. This figure below is a set of results they have generated for England (they preferred to use these data than accumulate for the whole of the UK, for reasons of consistency) where they assimilate different sets of data: first deaths, then deaths and hospitalised, and finally adding in case data on top (with some adjustments for consistency).
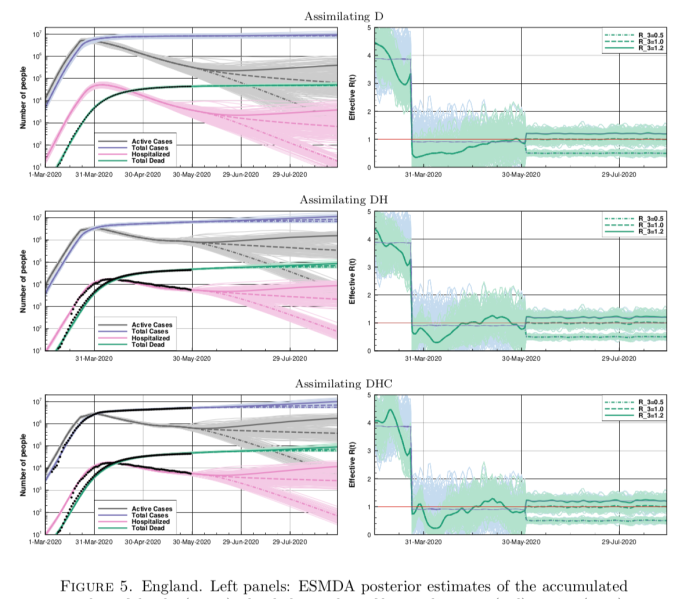
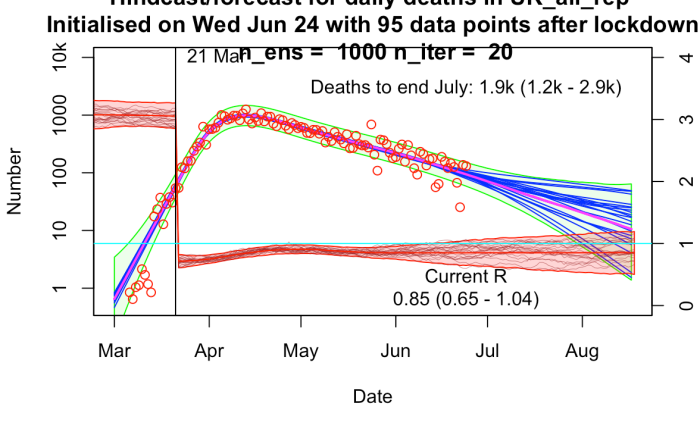
The results are broadly similar to mine, though their R trajectories seem very noisy with extremely high temporal variability – I think their prior may use independently sampled values on each day, which to my mind doesn’t seem right. I am treating R as taking a random walk with small daily increments except on lockdown day. In practice this means my fundamental parameters to be estimated are the increments themselves, with R on any particular day calculated as the cumulative sum of increments up to that time. I’ve include a few trajectories for R on my plot below to show what it looks like.
6 comments:
Hmmm. What do you think yesterday's R value did?
Bournemouth beach, Liverpool, ...
>What do you think yesterday's R value did?
UK Deaths 16th-19th June total 725
23rd-26th June total 767
So, potentially R_eff from 2 or 3 weeks ago more than 1, before much lockdown easing? Or just a fluke or am I missing some obvious explanation?
Lockdown easing is presumably only going to increase R.
Then, as you indicate, there are social distancing breaches to consider. BLM protests more significant than "crowded" beaches? Presumably in UK that isn't long enough ago to be affecting deaths 23rd to 26th June by much?
I was more commenting on the social distancing breaches.
TAC way to calculate R:
1 model based on cases, 1 based on deaths, and 3 multiple data models. Then average with equal weight.
Add in a few caveats like "Any changes in transmission that may have occurred in the past two to three weeks will not yet be reflected in clinical data, nor therefore in current estimates of Rt" and there you have it.
https://gov.wales/sites/default/files/publications/2020-07/advice-summary-24-july-2020.pdf
Perhaps that is a little unfair given it is an advice summary rather than a methods document but still ....
.
No tweets for a couple of days, hope everything is ok with you.
That's a good find. It looks like although it's a Wales document, it may be summarising the UK/SAGE approach which is worrying if true. Deaths cannot reasonably be considered on an equal footing to cases for estimating current R, though the cases do need a bit more interpretation.
(well, even deaths are bit unclear now with the fuss over what gets counted)
Yes my reaction was that they appear to be mixing deaths data with case data and these different data relate to different time periods. So they are smoothing things out and end up being slow to recognize what is happening with increasing cases while the deaths are still going down.
Post a Comment