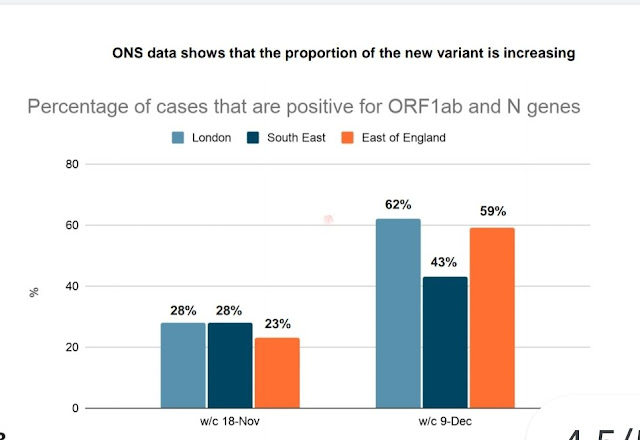
The summary is, yes it's real, yes it's serious, and the early signs are that it could be very difficult to maintain any semblance of suppression in the next month or two. Vulnerable people would be well advised to put off and/or cut down any risky activities at least for now, especially with vaccination just around the corner. It's not necessarily any worse if you catch it, but it is spreading rapidly and will be much more likely to infect you. The one glimmer of good news is that the vaccination seems to be progressing smoothly and at a decent pace, though obviously the sooner we can get more supplies of them, the better.
When the new variant was announced last week, I assumed (along with many others, I think) that its impact was probably exaggerated to cover up the govt's embarrassment over the Christmas U-turn. It was only a couple of days previously that Johnson had derided Starmer for suggesting that the Plaguefest plans should be reconsidered. Starmer had been the Grinch that wanted to Cancel Christmas! And now....it was Johnson doing the cancelling. Such is the effect of the torrent of lies and excuses and u-turns that we've been subjected to over recent months and even years. But....there is a new variant, and it is growing.
It has been traced back to September - one thing the UK actually can legitimately claim to be good at is genetic sequencing a sizeable proportion of samples - and has been getting more and more common since then. Here's an assessment from the ECDC on the 20th Dec. The blue line on this figure shows the proportion of samples containing the new variant, over several weeks (right hand scale).
It's been doubling every week over the second half of this period, a little quicker than that in fact. This isn't itself enough to tell us how fast is is growing in absolute terms, but the total number of positive cases was fairly flat over the relevant portion of this interval, maybe declining a little at the very end (the last week, number 47, is probably around 16-22 Nov). So that means it's close to doubling every week in absolute terms, which would work out at an R number of about 1.7, over a period of lockdown when the underlying R number for general infections was close to 1. Another set of data generates a somewhat lower estimate, but it's still clearly higher for the new variant than the old one:
The proportion of new variant roughly doubled in three weeks, but the total number of new cases was also well up over this period, meaning that the absolute growth rate for the new variant was faster than this.
A more comprehensive analysis was published last night by PHE and this is the key figure:
Each dot is the ratio of weekly growth rates for the new variant versus older type, over several weeks (colour coded) and different regions. The blue line is a fitted mean and it's clearly above 1. The scale is supposed to represent the ratio of R numbers for the two variants and they have made a slightly embarrassing error on this calculation which they may excuse as a reasonable approximation though there's no real reason to have done it as it's not really much harder to have done it correctly. It doesn't really matter so long as no-one considers the numerical result to be some precise truth. The point is that the new variant has a substantially larger growth rate, sufficient for case numbers to have actually been rising in absolute numbers during the latter part of the last "lockdown" in London. They get a typical advantage of about 0.5 in additive terms, or you could call it 1.7 as a multiplicative factor (these data mostly relate to during lockdown when R<1 was a reasonable assumption for the old variant). How the different R numbers relate may depend in part on the background restriction in place, it's not something really amenable to precision.
So the exact answer is uncertain, but it's quite plausible that the R number for this new variant could currently be as high as 1.5 now nationally or even higher, which suggests that it might be very hard to get it below 1 on any sort of sustainable basis. We certainly have a race against time to get as far through the vaccination list as quickly as possible. This calculator suggests that a 70 year old person with no additional health conditions might get vaccinated as early as Feb (though the estimate of 1 million per week is surely a bit of a guess). 80 year olds by late Jan. Even getting that far could cut total deaths in half:
(from ActuaryByDay who is pretty reliable though this figure assumes 100% effectiveness which is obviously a generous estimate, scaling the values by 0.9 to account for this would be an improvement and maybe another 0.8(??) to account for incomplete take-up.)
While we roll out the vaccine, it's surely worth re-emphasising the one obvious lesson of the last 9 months - that it's better to act quickly than to hope in vain that it's all going to turn out fine. If this new variant turns out to be anywhere near as bad as these data suggest, we should be acting with extreme urgency to buy ourselves as much time as possible. If it turns out to not be as bad as I'm suggesting, we can drop the restrictions quickly and the additional harm will be modest. Evidence is coming in quickly but the cost of delay is rising exponentially.


