This post was prompted by a silly twitter argument, about which probably the least said the better. Someone who has set themselves up as some sort of “climate communicator” had asserted that if we don’t halve our emissions in 12 years then the world as we know it will end. Moreover, anyone who even thought this assertion was controversial was, in their eyes, a denier. Well, I thought it was not so much controversial as simply false. But I did wonder, what is the actual effect of delaying decarbonisation of the global economy? In the sense of, let’s hypothesise that we actually can take policy action that decreases carbon emissions, what difference does it make when we start?
I’m sure people must have done (and published) these sort of calcs but to be honest I don’t recall seeing them. Most of the research I’ve seen seems to be more along the lines of: if we delay action then how much more stringent will it have to be, in order to meet a particular target? This pic below shows that sort of thing:
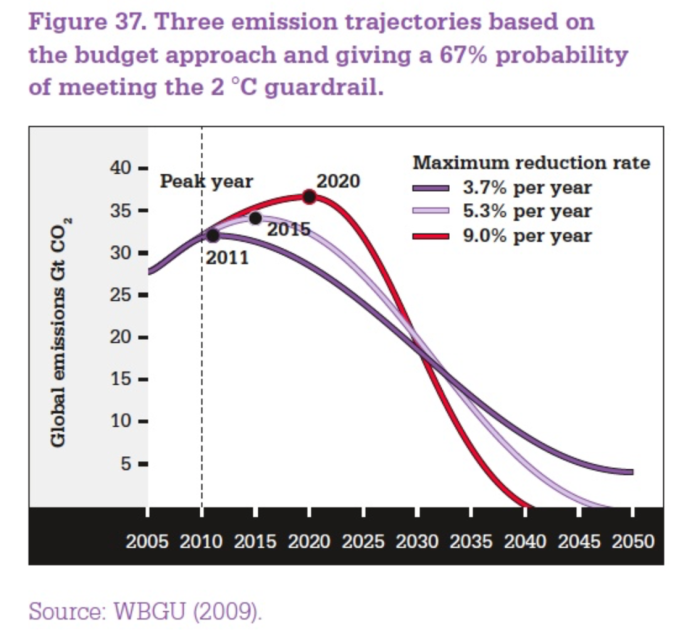
I don’t think this sort of thing is really all that helpful as it gives no clue as to how realistic any of the pathways are. It seems that this sort of graph is basically motivated by a political assertion (“let’s not let warming exceed X degrees|”) rather than any plausible understanding of the world we live in. I also don’t think it is very realistic to think that the world will design and implement carbon emissions policies that credibly aim at a particular max temperature change, at least not within my lifetime. So, here’s an alternative question that although still rather simplistic is (IMO) more directly relevant to the real world. Let’s assume we are able decarbonise at some given rate. How much difference does it make how soon we start?
To answer this, we have to model (a) CO2 emissions and how they vary with policy delays (b) how atmospheric CO2 concentrations vary with emissions (c) how climate change depends on CO2 concentrations, and finally perhaps (d) the economic impacts of climate change.
For (a), I assume an exponential growth rate for historical and future emissions up to the initiation of decarbonisation, followed by an exponential decline. I use a historical (and near future) growth rate of 1.9% in these calcs. For decarbonisation, I use a rate of 2% which would halve our emissions in 35 years. This is less than half the rate that would be required to halve emissions in 12 years as hypothesised earlier. Atmospheric CO2 concentrations are then provided from emissions by the equation of Myhrvold and Caldeira (2012). I could have used real historical emissions for the historical period of my simulation, but actually I get a marginally closer fit to historical CO2 concs when just using the exponential growth with my chosen rate. Three decarbonisation dates tested are 2020, 2030 and 2070. Ie starting now(ish), or alternatively after a delay of 10 or 50 years respectively.

Current CO2 concentration is about 410ppm, increasing by 2.5ppm per year. I didn’t bother distinguishing or labelling the three lines on each graph as it’s obvious which relates to which scenario. I have marked the date at which decarbonisation starts, so you can see how the concentration increases for quite a while after we start to cut emissions.
The resulting climate change is modelled by the widely-used two-layer model of Winton, Takahashi and Held (2010) discussed in several papers by Held, Winton and others (2010 ish). Parameter values can be changed in this model, but the only one that really matters here is the equilibrium climate sensitivity (ECS) to a doubling of CO2. For non-CO2 forcings (aerosols, volcanoes, methane etc) I use historical estimates for the historical era and just hold these fixed at their current values indefinitely into the future. The model simulation matches historical data pretty reasonably as shown below. The max temp rises (up to the year 2350) for the three scenarios are indicated on the graph, ie you get a 0.25C increase in max temp for a 10 year delay, and 1.6C for 50 years. In other words, each year of delay initially leads to an increase in ultimate warming of about 0.025C, and this number rises steadily to around 0.04C per year in the middle of the century. The differences in temperature seen by the year 2100 are a little less than this, eg at this time there is just under 0.2C difference between the 2020 and 2030 scenarios.
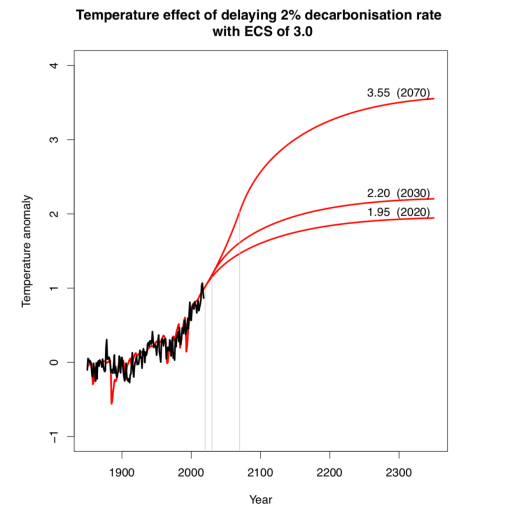
Raising the sensitivity of the model increases the ultimate temperature rise of course, and also increases the difference between the scenarios. For a sensitivity of 5C (hard to reconcile with what we believe) the 10y delay leads to an additional ultimate warming of almost 0.4C, though in this case significant warming is continuing beyond the end of the simulations in 2350 and the long-term differences will also grow gradually beyond this time. For sensitivity of 2C, the decadal delay leads to an ultimate difference of just under 0.2C, and is only 0.15C at 2100.
So this is the cost, in climate terms, of delaying decarbonisation. I don’t think the underlying assumptions are unreasonable, though no doubt some could be changed. The growth rate of emissions at 1.9% per year is probably debatable but (when fed through the Myhrvold and Caldeira equation) gives reasonable historical results. My decarbonisation rate is a guess, but results are not very sensitive to this. Eg if we can achieve 5% decarbonisation rate, then the cost of a 10-year delay is reduced slightly to just under 0.2C rather than the 0.25C I've calculated. Note that the starting point for this post was an assumption (assertion?) that we can decarbonise at 5% per year, otherwise the world is going to end anyway.
Evaluating the economic impact of the warming may be the most contentious part. Here I’ve just used an estimate based on a version of the (Nobel-winning) Nordhaus DICE model, which I also used in this paper. Other estimates are available, and I wouldn't be surprised if these impacts have nudged up slightly but I don't expect they would be radically different. I’ve also used a simple 2% per annum growth rate for past and future GDP which some may disagree with, especially when extrapolated out to 2350. But what else should I have done?
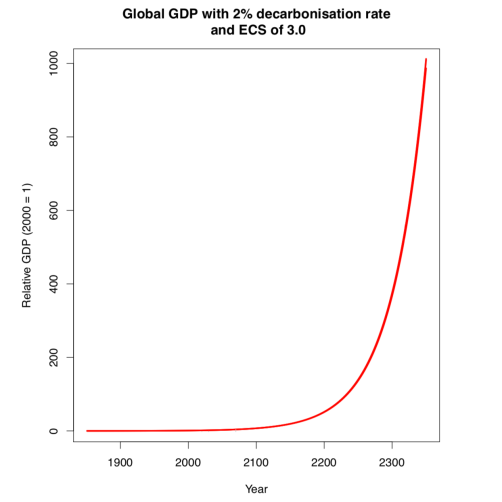
There are indeed three lines on this graph, but they aren’t very clearly separated! The 2%(ish) cost of modest climate change just isn’t very visible against the background of several orders of magnitude of economic growth. To be clear, I don’t think that everything can be readily boiled down to money – recent events show, many millions are apparently willing to squander untold billions (of other peoples’ money, of course) on the hypothetical benefits of "sovereignty". Yes, I’m talking about brexit, the costs of which will undoubtedly dwarf any plausible impact of climate change on the UK, for many decades to come. But even if we aren’t trying to maximise economic benefit, it’s still an interesting context for the impact of climate change policies.
At this point I will refrain from making any more rhetorical flourishes but will instead leave the reader to decide whether this analysis indicates an end to the world.