There’s been quite an amazing turnaround since my last blog post. At the time I wrote that, the Govt was insisting that schools would open as planned (indeed they did open the very next day), and that another lockdown was unthinkable. So my grim simulations were performed on that basis.
Of course, the next evening, we had another u-turn… schools shut immediately and many other restrictions were introduced on social mixing. Even so, most of the experts thought we would be in for a rough time, and I didn’t see any reason to disagree with them. The new variant had been spreading fast and no-one was confident that the restrictions would be enough to suppress it. Vaccination was well behind schedule (who remembers 10 million doses by the end of the year?) and could not catch up exponential growth of the virus.
Just after I posted that blog, someone pointed me to this paper from LSHTM which generated broadly similar results with much more detailed modelling. Their scenarios all predicted about 100k additional deaths in the spring, with the exception of one optimistic case where stiff restrictions starting in mid-December, coupled to very rapid vaccination, could cut this number to 30-40k. Given that we were already in Jan with no lockdown and little vaccination in sight, this seemed out of reach. Here is the table that summarises their projections. Note that their “total deaths” is the total within this time frame, not total for the epidemic.

However, since that point, cases have dropped very sharply indeed. Better than in the most optimistic scenario of LSHTM who anticipated R dropping to a little below 1. Deaths have not peaked quite yet but my modelling predicts this should happen quite soon and then we may see them fall quite rapidly. The future under suppression looks very different to what it did a couple of weeks ago.
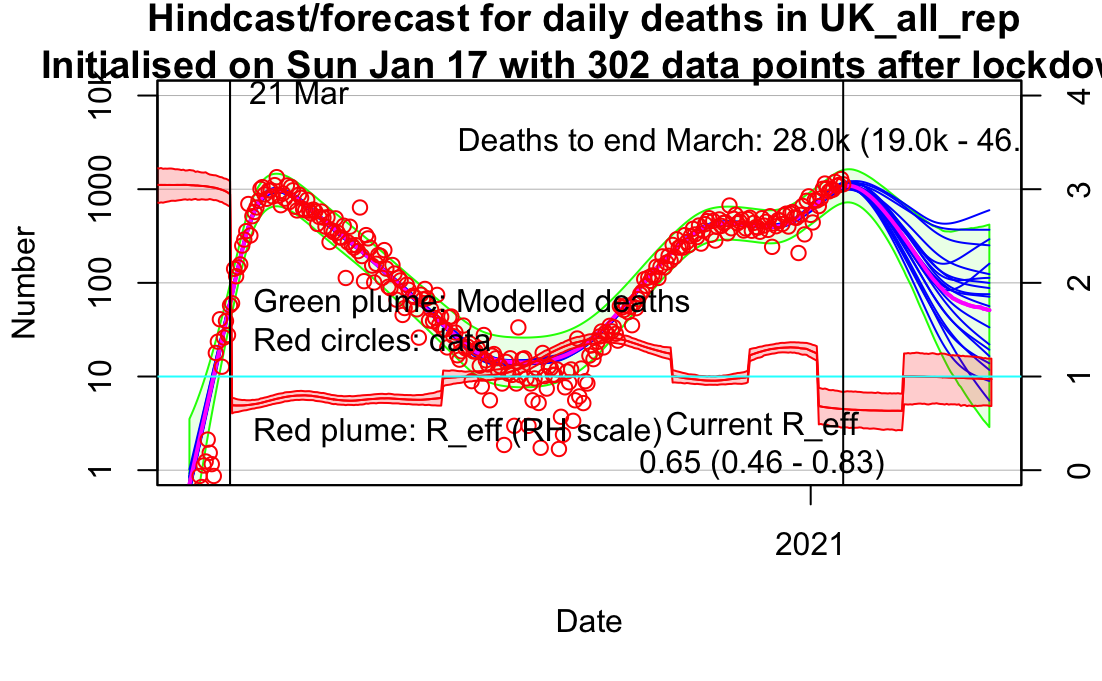
So this was the model fit I did back on 3rd Jan, which assumes no lockdown. Left is cases, right is deaths which rises to well over 1k per day for a large part of early 2021.


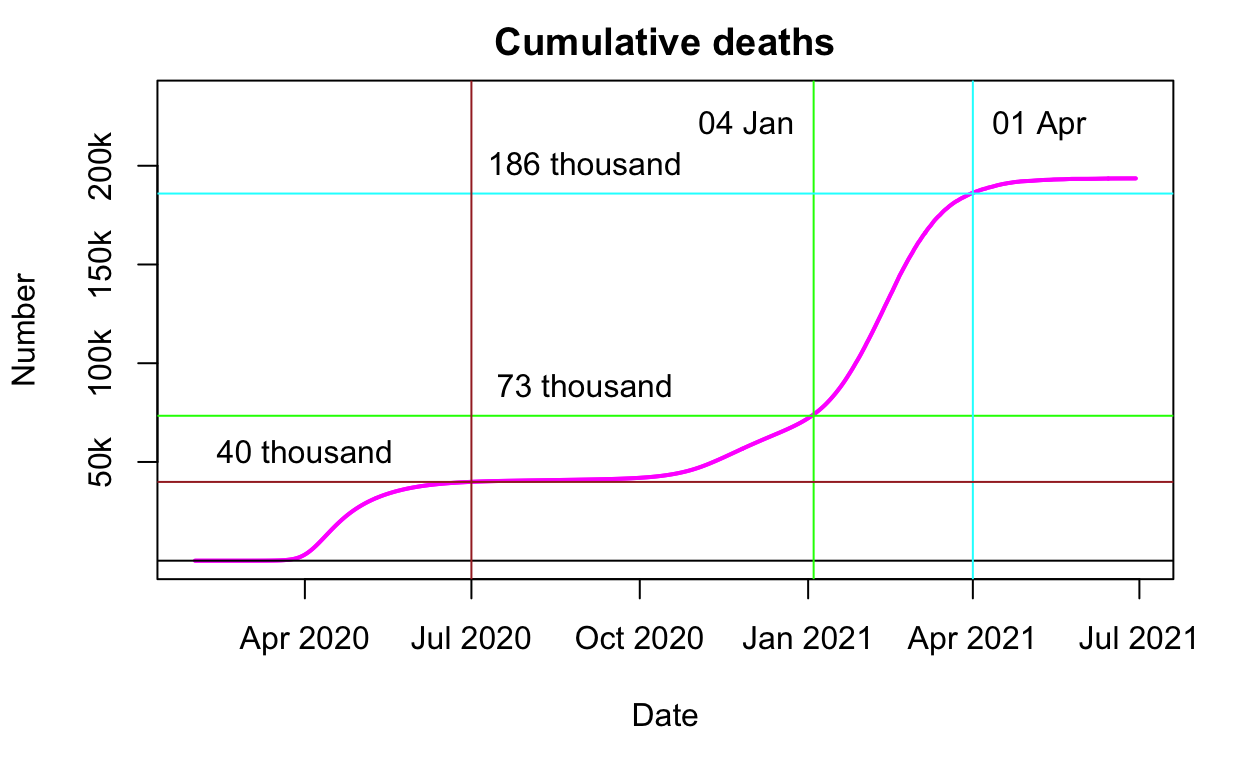
And here are the cumulative median infections and deaths corresponding to the above, with some grid lines marked on to indicate what was in store up to the end of Feb (for infections) and end of March (for deaths). As you can see, about 100k of the latter in this time frame (ie 186-73 = 113k additional deaths).

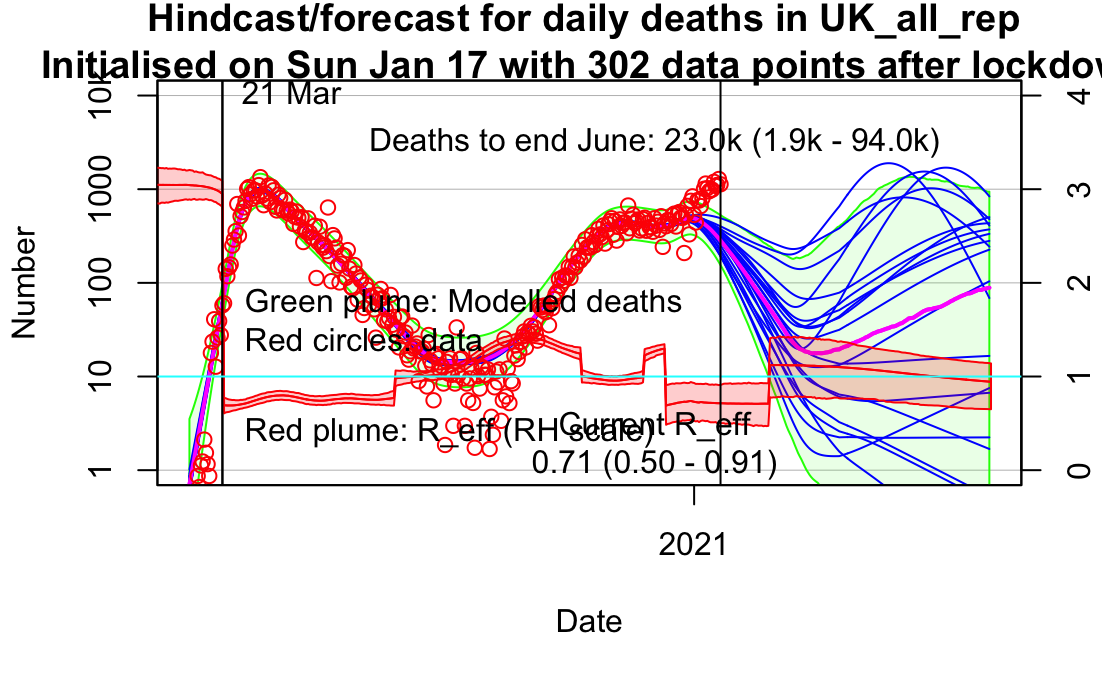
Here now are the graphs of the latest model fit showing the extremely rapid drop in cases and predicted drop in deaths assuming a 6 week lockdown:

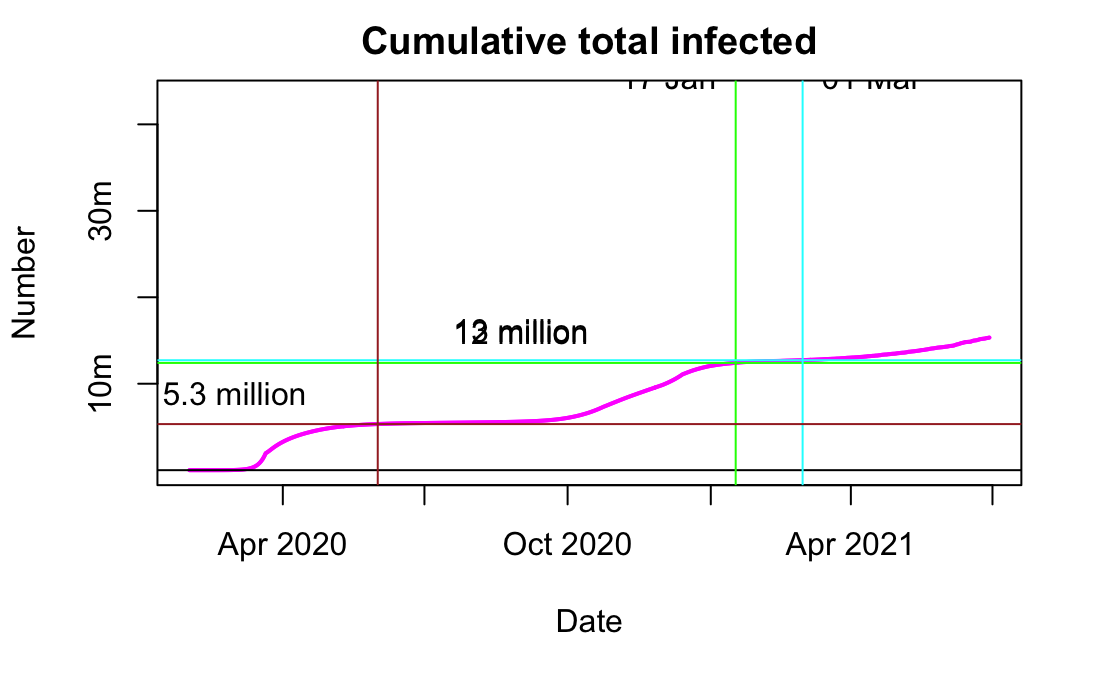
And here is the resulting median projection for total cumulative infections and deaths as a direct comparison to the previous blog post:

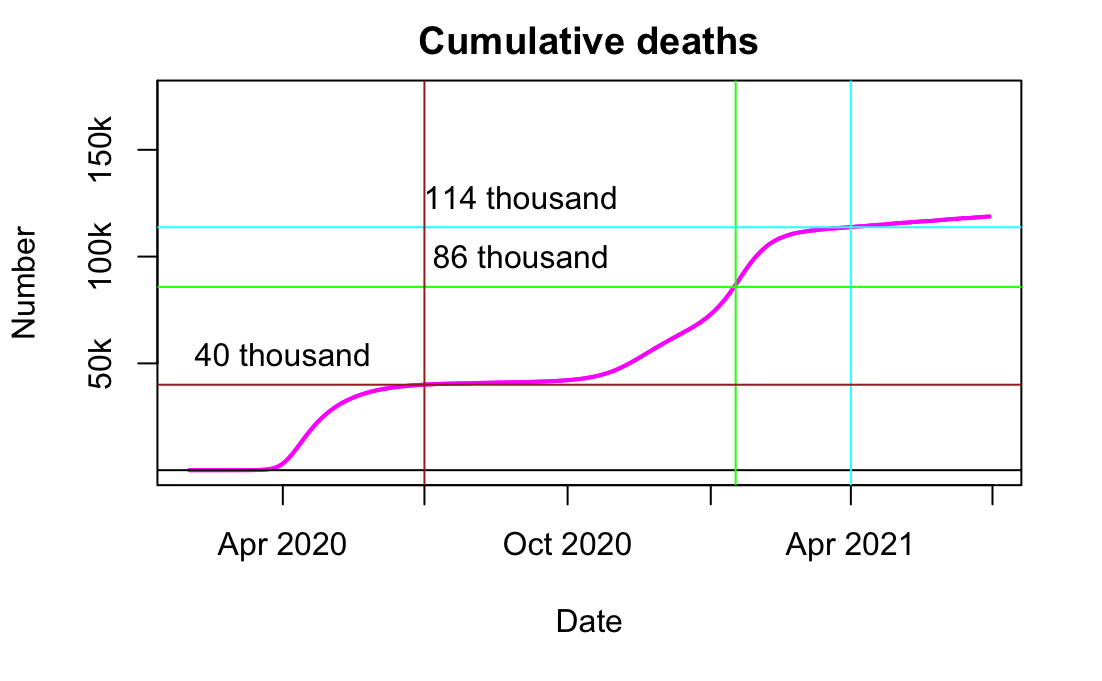
It’s a remarkable turnaround, and looks like we are on track for about 114-86 = 28k additional deaths (to start of April), which is far lower than looked possible a couple of weeks ago. It seems plausible that an large part of the reason for the striking success of the suppression is that the transmission of the new variant was predominantly enhanced in the young and therefore closing schools has had a particularly strong effect. The assumption that lockdown lasts for 6 weeks, and what happens after it, is entirely speculative on my part but I wanted to test how close we were to herd immunity at that point. Clearly there will be more work to be done at that time but it shouldn’t be so devastating as at present, unless we lose all our immunity very rapidly.
So that’s looking much better than it was. However it’s also interesting to think about what might have happened if the Govt had introduced the current restrictions sooner. Moving the start of the lockdown back by three weeks generates the following epidemic trajectory:

and the resulting cumulative infections and deaths look like:

Due to the automatic placing of text it’s not so easy to read but we end up with about 84000 deaths total (to end of March) which is fewer than we’ve already had.
So the additional 30k deaths seems to be the price we paid for Johnson’s determination to battle the experts and save Christmas.
3 comments:
Elsewhere, I saw this comment on when effect of holiday contacts would show in US data. (I noted that it had peaked on Jan 8).
"Daily cases are irrelevant. The supposed holiday effect would impact transmission. That means that it would affect the *slope* of the logarithm of daily cases, with a delay of a couple weeks. Looking at the logarithmic plot for the USA, it looks like it was steepest around the end of October, so transmission peaked in mid-October. It finally went negative a couple weeks ago, just about when it should have been spiking, according to the holiday transmission theory."
I really dont get what is meant. Does this make any sense?
Well I think there is some sort of point, in that the effect of interventions is noticed in a change in the growth rate rather than in the number of cases directly. However I don't see where they get this two week delay from as cases will respond more quickly than that to behavioural changes. I also haven't looked at the USA data.
I believe that you assume too small mortality from covid. My colleague just completed the analysis on the UK data, and his estimate is roughly 1 death out of 150 infected. This heavily depends on the distribution of infections between age groups, but this is roughly in the middle. Seventy five thousands deaths at January 1st would translate to 11 mln infections, not 15 mln that you assume.
Post a Comment