This post was prompted by a silly twitter argument, about which probably the least said the better. Someone who has set themselves up as some sort of “climate communicator” had asserted that if we don’t halve our emissions in 12 years then the world as we know it will end. Moreover, anyone who even thought this assertion was controversial was, in their eyes, a denier. Well, I thought it was not so much controversial as simply false. But I did wonder, what is the actual effect of delaying decarbonisation of the global economy? In the sense of, let’s hypothesise that we actually can take policy action that decreases carbon emissions, what difference does it make when we start?
I’m sure people must have done (and published) these sort of calcs but to be honest I don’t recall seeing them. Most of the research I’ve seen seems to be more along the lines of: if we delay action then how much more stringent will it have to be, in order to meet a particular target? This pic below shows that sort of thing:
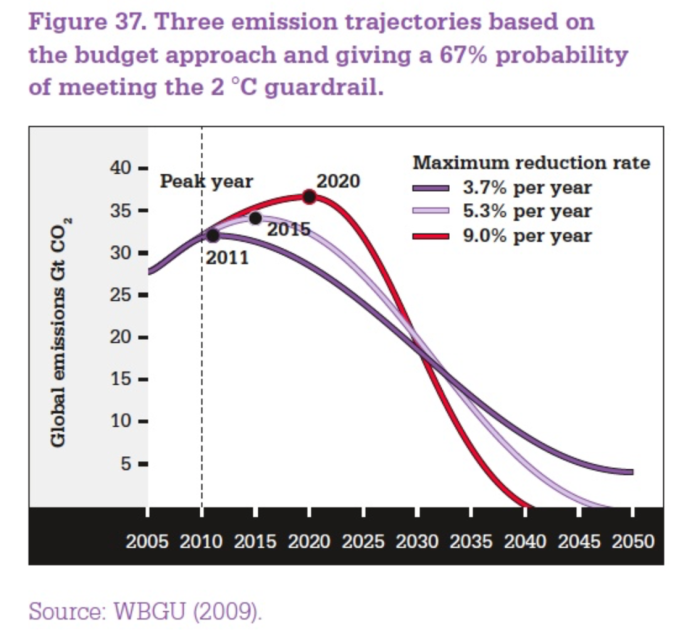
I don’t think this sort of thing is really all that helpful as it gives no clue as to how realistic any of the pathways are. It seems that this sort of graph is basically motivated by a political assertion (“let’s not let warming exceed X degrees|”) rather than any plausible understanding of the world we live in. I also don’t think it is very realistic to think that the world will design and implement carbon emissions policies that credibly aim at a particular max temperature change, at least not within my lifetime. So, here’s an alternative question that although still rather simplistic is (IMO) more directly relevant to the real world. Let’s assume we are able decarbonise at some given rate. How much difference does it make how soon we start?
To answer this, we have to model (a) CO2 emissions and how they vary with policy delays (b) how atmospheric CO2 concentrations vary with emissions (c) how climate change depends on CO2 concentrations, and finally perhaps (d) the economic impacts of climate change.
For (a), I assume an exponential growth rate for historical and future emissions up to the initiation of decarbonisation, followed by an exponential decline. I use a historical (and near future) growth rate of 1.9% in these calcs. For decarbonisation, I use a rate of 2% which would halve our emissions in 35 years. This is less than half the rate that would be required to halve emissions in 12 years as hypothesised earlier. Atmospheric CO2 concentrations are then provided from emissions by the equation of Myhrvold and Caldeira (2012). I could have used real historical emissions for the historical period of my simulation, but actually I get a marginally closer fit to historical CO2 concs when just using the exponential growth with my chosen rate. Three decarbonisation dates tested are 2020, 2030 and 2070. Ie starting now(ish), or alternatively after a delay of 10 or 50 years respectively.

Current CO2 concentration is about 410ppm, increasing by 2.5ppm per year. I didn’t bother distinguishing or labelling the three lines on each graph as it’s obvious which relates to which scenario. I have marked the date at which decarbonisation starts, so you can see how the concentration increases for quite a while after we start to cut emissions.
The resulting climate change is modelled by the widely-used two-layer model of Winton, Takahashi and Held (2010) discussed in several papers by Held, Winton and others (2010 ish). Parameter values can be changed in this model, but the only one that really matters here is the equilibrium climate sensitivity (ECS) to a doubling of CO2. For non-CO2 forcings (aerosols, volcanoes, methane etc) I use historical estimates for the historical era and just hold these fixed at their current values indefinitely into the future. The model simulation matches historical data pretty reasonably as shown below. The max temp rises (up to the year 2350) for the three scenarios are indicated on the graph, ie you get a 0.25C increase in max temp for a 10 year delay, and 1.6C for 50 years. In other words, each year of delay initially leads to an increase in ultimate warming of about 0.025C, and this number rises steadily to around 0.04C per year in the middle of the century. The differences in temperature seen by the year 2100 are a little less than this, eg at this time there is just under 0.2C difference between the 2020 and 2030 scenarios.
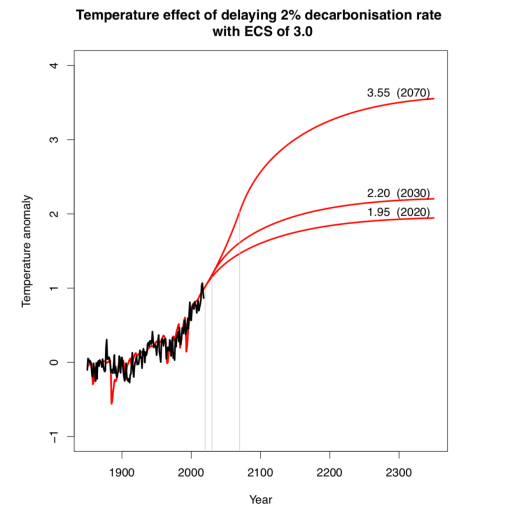
Raising the sensitivity of the model increases the ultimate temperature rise of course, and also increases the difference between the scenarios. For a sensitivity of 5C (hard to reconcile with what we believe) the 10y delay leads to an additional ultimate warming of almost 0.4C, though in this case significant warming is continuing beyond the end of the simulations in 2350 and the long-term differences will also grow gradually beyond this time. For sensitivity of 2C, the decadal delay leads to an ultimate difference of just under 0.2C, and is only 0.15C at 2100.
So this is the cost, in climate terms, of delaying decarbonisation. I don’t think the underlying assumptions are unreasonable, though no doubt some could be changed. The growth rate of emissions at 1.9% per year is probably debatable but (when fed through the Myhrvold and Caldeira equation) gives reasonable historical results. My decarbonisation rate is a guess, but results are not very sensitive to this. Eg if we can achieve 5% decarbonisation rate, then the cost of a 10-year delay is reduced slightly to just under 0.2C rather than the 0.25C I've calculated. Note that the starting point for this post was an assumption (assertion?) that we can decarbonise at 5% per year, otherwise the world is going to end anyway.
Evaluating the economic impact of the warming may be the most contentious part. Here I’ve just used an estimate based on a version of the (Nobel-winning) Nordhaus DICE model, which I also used in this paper. Other estimates are available, and I wouldn't be surprised if these impacts have nudged up slightly but I don't expect they would be radically different. I’ve also used a simple 2% per annum growth rate for past and future GDP which some may disagree with, especially when extrapolated out to 2350. But what else should I have done?
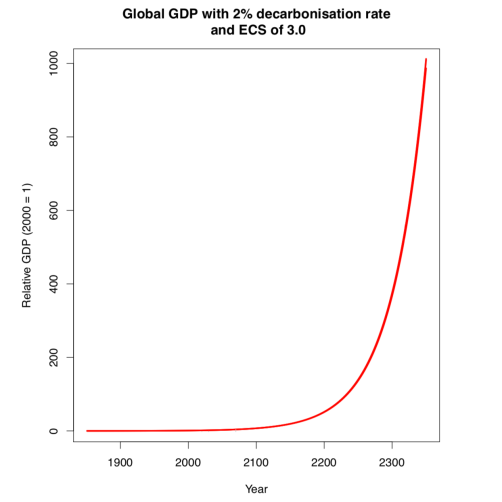
There are indeed three lines on this graph, but they aren’t very clearly separated! The 2%(ish) cost of modest climate change just isn’t very visible against the background of several orders of magnitude of economic growth. To be clear, I don’t think that everything can be readily boiled down to money – recent events show, many millions are apparently willing to squander untold billions (of other peoples’ money, of course) on the hypothetical benefits of "sovereignty". Yes, I’m talking about brexit, the costs of which will undoubtedly dwarf any plausible impact of climate change on the UK, for many decades to come. But even if we aren’t trying to maximise economic benefit, it’s still an interesting context for the impact of climate change policies.
At this point I will refrain from making any more rhetorical flourishes but will instead leave the reader to decide whether this analysis indicates an end to the world.
23 comments:
In Britain it will be your money.
Brexit means Broke.
Remain!
Gosh this is confusing: the same post in two different places.
FWIW, this is the only one that Feedly tells me about. I tried to get it to tell me about the "direct" one, https://bskiesresearch.wordpress.com/2019/01/27/costs-of-delaying-action-on-climate-change/, but it wouldn't.
Which one do you regard as the "real" post?
I have no problems getting a feed on both blogs (also via feedly). Wonder what is going wrong?
Blueskies is the corporate face of Blueskies Research Ltd and thus is limited in scope, carefully manicured and stage-managed. The Empty Blog will publish any old rubbish. The duplication has been going on since day one so I hope it hasn't been too disconcerting for you to finally notice it :-)
As for which is more real...you are the philosopher, I was hoping you could tell me!
You really do need a 'the end is nigh' scenario. Something that involves a boiling flood well beyond biblical proportions.
Well I suppose I can just do the 1.9% pa compound increase in CO2 emissions unabated, which gets us to 66000 ppm CO2 by 2350 with a temp rise of 12C and a GDP increase to only 600 times present (a little over half the results plotted). Scary enough for you?
(I don't think the GDP result is particularly credible when extrapolated out to such a strong warming. 12C warming really would be the end of the world as we know it!)
Is your two-layer model from Winton, Takashi & Held (2010) which, after a brief glance, seems to use a zero-dimensional, energy balance model, or is it the one presented in Held et al. (2010) - Probing the Fast and Slow Components of Global Warming by Returning
Abruptly to Preindustrial Forcing?
Oops sorry yes the two-layer model. Was trying to track down the first ref to it....will edit the post.
Nice post.
I suspect that some of the push to claim that we have N years to act or face doom is an effort to cast climate change into a problem that most humans can deal with. Climate change is slow.
Your 66000 ppm scenario in the comments, that is about 8 doublings of CO2. Only 12 C warming? What am I missing? This is matches the fast warming of 1.5C per doubling from (DOI: 10.1175/2009JCLI3466.1), or "transient climate sensitivity" but isn't there going to be substantial "recalcitrant" warming as well by 2350? Such as in Figure 4, for a much smaller forcing?
Yes there would indeed be a lot of warming in the pipeline at that point, but I'm only running to 2350 (ie 500 years from the start). The temperature graph is basically a linear ramp for as long as emissions go up exponentially.
If "doom" is 1.51 degrees of warming then of course that gets much more difficult for even a short delay - but this is already a discussion about degrees of impossibility at the outset, cos we are not actually going to halve emissions in 12 years. Even a immediate 2% pa decarbonisation wouldn't save us here unless we are lucky with a low sensitivity.
"Together, PV and wind currently produce about 7% of the world’s electricity. Worldwide over the past five years, PV capacity has grown by 28% per year, and wind by 13% per year. Remarkably, because of the slow or nonexistent growth rates of coal and gas, current trends put the world on track to reach 100% renewable electricity by 2032."
https://cosmosmagazine.com/technology/solar-and-wind-will-replace-fossil-fuels-within-20-years
If it seems to be happening anyway ..... should we just forget about the problem? ;)
hmm. post appears here but not on earlier posts. Tried to post this in predictions thread:
>"nothing has changed"
You article 50 revocation odds mentioned of 5 have gone up to 10. Note that an extention means you lose this bet and with article 50 extension at 1.33, if you believe the probability implicit in that then perhaps you should prefer my suggested Brexit not before 2022 bet which has changed from 3.5 to 5.1.
Nothing has changed except the odds??
(Yeah I know all odds/probabilities are subjective and yours may have remained unchanged and nearer to some impossible perfect objective assessment.)
>"any specific scenarios to test"
Well, we were discussing how much and how fast the sinks reduce on a sudden change to zero emissions. Does that Myhrvold and Caldeira equation give a sensible projection of CO2 levels following emissions being suddenly cut to zero?
crandles,
So 7% (Solaw+Wind) times 35% equals 2.45% of current 25,000 TWh/yr of total world energy demand ...
https://cosmos-magazine.imgix.net/file/spina/photo/14719/180407-solar-1.png
:/
So, sort of not believing ~exponential growth of Solar+Wind of ~40% per annum through 2032. But let's assume 40% per annum growth until Solar+Wind = total world energy demand in year 2033, an additional year added onto this graph ...
https://cosmos-magazine.imgix.net/file/spina/photo/14717/180407-solar-3.png
or a doubling time of ~two years (~1.4^2 = 1.96). Very doubtful.
only "sort of not believing" ?!
OK, you convinced me that the doomster was wildly exaggerating; but I still get the feeling that this type of post runs the great risk of being read as political justification for not starting strong policy towards CO2 reduction.
Your examples showed that on a certain hypothetical, consistent rate of reduction, it wouldn't make much difference if you start now or in ten year's time.
It also showed that not starting til 2070 would lead to the pretty disastrous 3 degrees by mid next century. If we count that as close enough to "doom", then there is presumably some year between 2030 and 2070 which is the absolutely, last chance, if-we-can-do-this-at-two-per-cent-per-year-every-year-we-must-start-now year for avoiding the (pretty rapid) rise to 3 degrees.
But doesn't that give political cover for "we've still got maybe 20 or 30 years before we get really serious?"
The GDP graph is even worse: while glad to see you say that you can't measure everything by GDP, such graphing is exactly what the libertarian "we will just make ourselves rich enough to aircondition every building on the planet and it won't be an issue" twits use to justify not doing anything. Never mind the extinctions, the mass migrations of humans, the flooded cities, the increased natural disasters, the God knows what potential effects of acidification of the oceans.
Isn't it high time that the Pindyck criticisms of the current economic modelling of climate change are taken to heart?
Hi Chris,
Ok here are results from a sudden stop in emissions. Cols are years, emissions in ppm CO2 equiv, atmosphere conc and the annual increment. The drop is immediate but modest and tails away fairly quickly. Which I think is what I said. I hope :-)
The temp stays very flat, it actually drops a whisker for a few decades before increasing very gradually over the centennial time scale. Due to the deep ocean gradually warming.
[159,] 2010 3.9877255 386.2585 2.04413596
[160,] 2011 4.0634923 388.3413 2.08285478
[161,] 2012 4.1406986 390.4636 2.12230999
[162,] 2013 4.2193719 392.6261 2.16251556
[163,] 2014 4.2995400 394.8296 2.20348574
[164,] 2015 4.3812312 397.0749 2.24523507
[165,] 2016 4.4644746 399.3626 2.28777833
[166,] 2017 4.5492996 401.6938 2.33113060
[167,] 2018 4.6357363 404.0691 2.37530726
[168,] 2019 4.7238153 406.4894 2.42032396
[169,] 2020 4.8135678 408.9556 2.46619665
[170,] 2021 0.0000000 406.5635 -2.39208398
[171,] 2022 0.0000000 404.7401 -1.82341108
[172,] 2023 0.0000000 403.1955 -1.54462036
[173,] 2024 0.0000000 401.8031 -1.39232590
[174,] 2025 0.0000000 400.5070 -1.29612394
[175,] 2026 0.0000000 399.2814 -1.22562982
[176,] 2027 0.0000000 398.1137 -1.16768541
[177,] 2028 0.0000000 396.9972 -1.11655029
[178,] 2029 0.0000000 395.9275 -1.06968026
[179,] 2030 0.0000000 394.9016 -1.02591050
As for solar, no I don't think we should just sit back and watch but I do expect to see PV continue to grow hugely in my lifetime. Have been meaning to blog about this for a while. Note that electricity is only a proportion of total energy consumption.
Steve, I don't make a judgement about whether 0.025C/year matters. I just wanted to calculate the number (which doesn't greatly surprise me).
I agree the economic modelling has...limitations. Again, it is what it is. If someone comes up with a better model to summarise the effects of climate change, I'd happily use it.
Hi, and thank you for the numbers. 2.392 going into sinks looks to be just a little larger than in each of the past three years and wasn't what I was expecting. Much nearer to what you said, but I'm not sure either of us were expecting increase in that first year.
Sinks of 1.0259 is less than 43% of the 2.392 in just 9 years. I would doubt that continues as an exponential decline.
Not sure I believe the temperature profile you say is produced but that is because I would expect sulphur aerosols to reduce with coal production and we would likely get a rapid increase in temps for a year or two before settling to a slow rise as the ocean slowly catches up. I guess you left aerosols unaffected so that isn't a real criticism of what that model produced. Anyway sudden zero emissions are totally unrealistic.
>"don't think we should just sit back and watch"
>"Again, it is what it is."
I have no problem with you saying "it is what it is" But if you don't think we should just sit back and watch, then rather than leaving your post as rant suggesting we have more time if we wish, shouldn't you be framing your post more as it is the nature of the CC problem that we could always argue to wait a few more years until we get to the point where we can say it is too late now. e.g. Thwaites is in irreverible retreat which will lead to 80cm of sea level rise or whatever the first serious domino is.... And oops we have past that.
Then can't tell when first serious domino will fall so there is no better time to start than now.
Or is this still alarmist nonsense?
Chris, this version of the model only has a 1y tilmestep so the details within that time scale are a bit imprecise. In fact the sink into deep ocean for the first year (after stopping emissions) won't see the atmospheric conc at all, whether it was +100 or -100 would make no difference. A shorter time step (but the same underlying equations) would change that just a fraction I think.
Carbon equation has 3 time scales (and 20% of emissions stay in atmosphere for ever) so a simple exponential won't describe it well. Still 340ppm at 2350 in this scenario.
Yes I did keep aerosols etc fixed, it would probably be more sensible to reduce them in proportion to emissions as a first approximation (even faster perhaps).
I don't think 0.25c/decade is really an invitation to delay. We've only had 1C actual warming in the past century. Anyway I would rather know the number (together with some sensitivity analyses etc) than not.
Glen Peters does a nice line in figuring out how the start date for mitigation affects physical outcomes such as global temperature anomalies https://twitter.com/Peters_Glen/status/1074584527438274560 for example. Also at 66000 ppm you start pushing the emitting level from CO2 bands way into the stratosphere and if water vapor concentration follow then the tropopause disappears. Indeed you get planet B.
So yes, there are catastrophic levels. If you want to actually confront the issue, at what levels of CO2 will there be significant parts of the year when living in the area between the Persian Gulf and Australia becomes impossible and when do we have to start mitigating so we don't reach that level. That may be one to two decades.
Thanks, I knew I'd seen better pics than the one I pasted at the top. Again, of the "trajectories consistent with a budget" variety rather than the "trajectories arising from a delay" I was interested in.
I don't really get the "impossible" though. This argument started with someone showing maps of "deadly" temperatures that were in fact already regularly encountered and survived by very large populations. I don't doubt it will get more unpleasant in those areas though.
Impossible means that metabolic heat dissipation would become impossible and thus the areas would become unsuitable for human habitation. That only need be for even small parts of the year to effectively lose major swathes of territory for year-round habitability.
>"I don't really get the "impossible" though"
I think we should get away from "impossible" considerations more towards considering Earth's carrying capacity.
"Dr. Peter Harper of Health and Safety Executive has determined that exposure to lower levels, starting at 84,000 ppm for 60 minutes or more, will also result in fatality."
Just because it is still not impossible to live with scuba tanks and air tight CO2 regulated living areas, do you think Earth's carrying capacity isn't reduced by at least a couple of orders of magnitude? Or is 350 years to prepare still the dominant factor?
Not sure I see the point contemplating this, the effects are too devastating and restrictive on the future to contemplate even if the GDP is expected to be higher going down such a route. I doubt a sensible economic analysis would reach that conclusion.
I assume Eli was talking about the recent paper discussing the "deadly" effects of a degree or two of warming, not 66000ppm CO2.
Post a Comment