(Small edit made 21 Apr to add a corollary at the bottom of the post.)
I’ve said bits of this in various places and at various times to various people, but I don’t think I have written it down in a complete and coherent form. Actually, bits and pieces of the story have come to me at different times and in different ways, so perhaps I didn’t have a coherent story before. Anyway, it seems important and I don’t want it to get whitewashed from history, so here goes.
I’ve said bits of this in various places and at various times to various people, but I don’t think I have written it down in a complete and coherent form. Actually, bits and pieces of the story have come to me at different times and in different ways, so perhaps I didn’t have a coherent story before. Anyway, it seems important and I don’t want it to get whitewashed from history, so here goes.
The story possibly starts on the 12th March, when Vallance stated that we were 4 weeks behind Italy. And also, quite specifically the peak was 3 months away:
For the UK, the peak is expected to fall in three months' time, likely in the summer months, and tail off throughout the autumn, the government said. Vallance said that the UK is around four weeks behind Italy
It’s fair to say the “4 weeks” comment was met with a bit of scepticism by the general public, eg here. And here. When the Govt’s Chief Scientist is being openly mocked for his comments, it seems to me that something is seriously wrong. For context, on the 12th March we’d had about 500 cases and 8 deaths. 15 days earlier on the 26 Feb, Italy had had very similar numbers – in fact slightly fewer cases and more deaths. In both countries, the numbers of cases and deaths were doubling roughly every 3 days, meaning we would get to Italy’s then current values of 20,000 cases and 144 deaths in about a fortnight or so (5 doublings = 32x). 4 weeks was obviously risible.
Then a few days later the 16th March, Vallance talked specifically about a 5 day doubling time (on this youtube video, starting from 27 mins in). And people were puzzled. 5 day doubling would indeed put us about 4 weeks behind Italy (ie the required 5-and-a-bit doublings would take about 26-27 days), but Italy wasn’t doubling every 5 days, and neither were we. We were both doubling on a 3 day time scale instead, possibly quicker than that.
It was actually jules who cottoned on to this first. She had been looking at the numbers more than me, and working out the doubling rate. At this point I was more thinking about the govt’s strategy to fill the streets with bodies under their “herd immunity” plan. It seemed very clear that the weight of critically ill people was going to be a huge burden that the NHS would have no possibility of treating, and my first blog post (which didn’t even have a proper model in, just some curves) focussed on that particular detail.
Anyway, 5 day doubling. Where did this come from? Took me a little while to work it out. It wasn’t until I got hold of the SEIR model and started playing around with it that it started to come together. Ferguson had posted a paper on the 16th March that outlined his modelling. Although his model is of course far more detailed than the SEIR model I was using, it described the parameters in enough detail to emulated rather well by my simpler model. And….the doubling rate he had used was 5 days. You don’t need to do too much digging – or have a great deal of expert knowledge – to find it in the paper:
a 6.5-day mean generation time. Based on fits to the early growth-rate of the epidemic in Wuhan, we make a baseline assumption that R0=2.4 but examine values between 2.0 and 2.6.
What this means is, the number of cases grows by a factor of 2.4 in 6.5 days. Which is equivalent to doubling in 5.1 days. They just imposed that – admittedly, the parameters were estimated from the Wuhan outbreak, but this result came a very small data set very early on. It is also well known that the basic reproductive rate R0 depends on the social context and it’s far from certain that it would transfer directly from the Chinese denizens of a wet market to the population of the UK. To some extent, the effective duration of the period in which people pass on the infection could vary in practice vary too, depending on whether people go to bed or go to work etc. So there is simply no way that putting in the first estimate for Chinese parameters (with a modest uncertainty range) could be considered a robust and reliable modelling strategy, especially since there was already strong evidence that these values were not appropriate even for the later growth of the Wuhan outbreak let alone closer to home. There was ample evidence from other European countries that their doubling rates were far faster than 5 days, and growing evidence from the UK that we were following the same path.
I did a bit more playing around with my model, including parameter estimation, and quickly came to the realisation that R0 had to be rather larger than Ferguson had said.
I emailed Neil Ferguson about this on the 27th, and also CCed David Spiegelhalter, on the basis that as a public-facing stats expert with a strong interest in health he’d get what I was talking about and realise it was important..and, well, they did reply which was more than I was really expecting, but only to politely brush me off. Prof Ferguson did at least acknowledge that he now thought a higher value of R0 in the range of 2.8-3 was appropriate. And true enough, the very day I emailed them, Govey had talked of a 3-4 day doubling. But that requires a rather larger R0 in the range of of 3 to 4 (assuming the same 6.5 day time scale), and is still a bit slower than the data were consistently showing. Later research from IC with a simpler model pointed to a value of around 4.
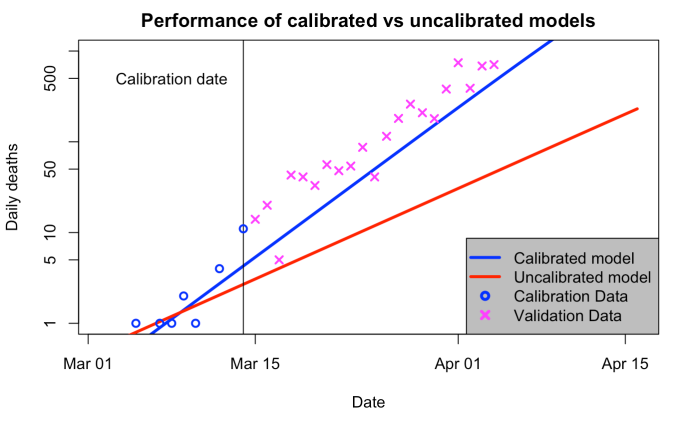
As for why this matters, here are results from two model simulations. One of them – the uncalibrated one – is very close to what the IC group showed to the Government. The other one is what you get if you calibrate the model to the growth rate shown in the UK data that was available at that time.
For the red line, I used Ferguson’s model parameters and initialised the model as he described in his paper, timing the epidemic so that it had the correct number of total deaths (21) up to 14 March. For the blue one, I first fitted the parameters to the time series of cases reported in the UK, which were probably reasonably reliable up to that time as they were still tracing contacts and testing etc. Similar parameters would have been obtained from fitting to Italy, Spain and the Wuhan outbreak. I then initialised the simulation as for the red curve (daily deaths on 14th are slightly different but the integral up to that date is the same).
Want to guess which one is closer to the future observations? Well, you don’t have to. The initialisation leaves the blue line about a day or two behind reality (only!) but tracking it at the same rate. The red line…just…well. No comment. The logarithmic axis really helps to hide how far away from reality it is.
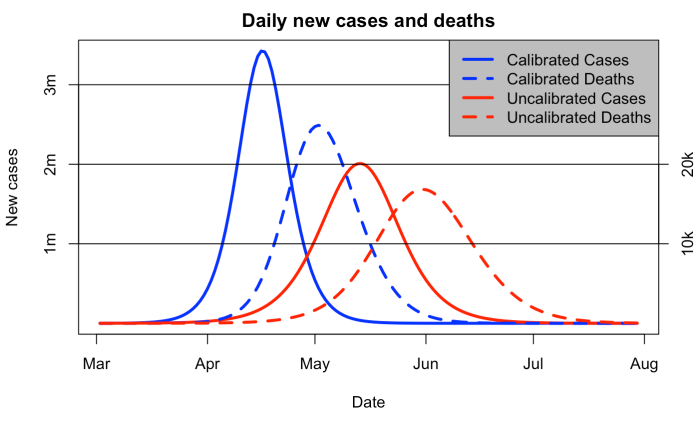
And as for why this really mattered…the red curve below was how the Ferguson et al model predicted the epidemic was going to pan out. A couple of months to the peak in infections and deaths following almost a month after that. Terrible, but still a little way away, and and Vallance was saying we mustn’t suppress the epidemic too quickly.
However, in reality we were on the blue curve. A peak of over 3 million new cases per day was less than a month away. Well over 20k deaths per day at the start of May. And the govt was just shilly-shallying around.
The big puzzle for me in all this is, why on earth didn’t Ferguson calibrate his model to the 3-day doubling exponential growth rate that was clearly visible in the data? Ok, perhaps I’m a bit biased due to model calibration being basically what I have spent the last couple of decades on, but it’s a pretty fundamental component of forecasting in every field of science that you can think of. Apart from this one, it seems. Every weather forecast is generated by a model that’s tuned to look like reality, both in terms of parameters (as part of its design and commissioning) and also initialised to look like today’s weather. The epidemiologists did the latter ok – choosing a start date to fit their epidemic to start about the right time – but never bothered to tune their parameters to match the growth rate.
It will, I suspect, forever remain a mystery as to why this happened.
A small corollary of the above, added on 21 Apr: It is very straightforward to calculate the effect of a delay to the lockdown. A week of unchecked growth at 3-day doubling corresponds to a factor of 5, meaning that 80% of the total size of the first wave we are currently in could be directly attributed to the Govt delaying by a week, if it was felt that the evidence could and should have supported action that much sooner (ie, when most of the rest of Europe was taking action). That means 80% of the peak strain on the NHS, 80% of total cases and also 80% of all resulting deaths. What this calculation doesn't account for, is what happens in the longer term. We may all get it in the longer term anyway (well 60%+ of us). But we might not, and even so, the huge peak was 5x bigger than it would have been if controlled just a week quicker.
A small corollary of the above, added on 21 Apr: It is very straightforward to calculate the effect of a delay to the lockdown. A week of unchecked growth at 3-day doubling corresponds to a factor of 5, meaning that 80% of the total size of the first wave we are currently in could be directly attributed to the Govt delaying by a week, if it was felt that the evidence could and should have supported action that much sooner (ie, when most of the rest of Europe was taking action). That means 80% of the peak strain on the NHS, 80% of total cases and also 80% of all resulting deaths. What this calculation doesn't account for, is what happens in the longer term. We may all get it in the longer term anyway (well 60%+ of us). But we might not, and even so, the huge peak was 5x bigger than it would have been if controlled just a week quicker.
39 comments:
I don't see the mystery. The climate modelers are more sophisticated than the epidemiologists and might well be more numerous and better funded.
Somehow I came across the fundamental
https://en.m.wikipedia.org/wiki/Tracy%E2%80%93Widom_distribution
I don't yet see the connection here, fuly, but I bring it to your notice.
It is surprising that Ferguson didn't do a better job. It's pretty obvious however that given large uncertainties in the deaths data, there is a huge danger of overfitting the models. We have absolutely no idea how many people have been infected even though the best evidence indicates that official data is vastly understated (by a factor of 28-85). Also IFR's are dramatically overestimated particularly for healthy people under 65 years of age who appear to have infinitesimally small mortality risk as per a real expert in the field.
Just an example of how ignorant we are. One New York City hospital began testing women admitted to deliver a baby for active covid19 infection. Of 200 tested, 15% had infections. Virtually all were asymptotic. Extrapolating this to the City, this would seem to imply perhaps 1.8 million active cases at that time. That's vastly more than official statistics.
As in many fields of science where uncertainty is high, better data is where the investment needs to be made. While I applaud your work on this, I don't find it very definitive either just because the data is so bad.
The other issue here in terms of estimating the effects of lockdown and current vs. initial R0's is that we have no way of knowing if herd immunity has already kicked in. If we believe the best evidence from around the world, infections have been understated by perhaps a factor of 50 to pick a round number. In New York State, there are 256K confirmed cases, most of them in New York City. It's worth noting that this now includes those who die at home and are by some process deemed to be covid19 deaths. Testing positive is no longer required. Roughly that would indicate that the number of infections might be 12.5 million admittedly give or take a large number given the high uncertainty. If they are concentrated in the City of New York, herd immunity might be already achieved or nearly so. That would explain why new hospital admissions have fallen dramatically and rapidly. I don't have a lot of confidence however in this reasoning absent serologic population testing. There is other evidence that supports it however albeit ambiguous such as what I mentioned previously.
Another issue here is the strong age dependence of the deaths. There are probably a hundred thousand people in New York state who are on death's door and have terminal conditions such as cancer, congestive heart failure, are obese and have metabiolic syndrome, etc. The first wave kills almost exclusively in this cohort. As time goes on there are simply a lot fewer people at significant risk of death. This could easily be causing flattening in New York City but probably not anywhere else in the US.
In the rest of the US, hospitals are half empty and are closing or laying off employees. Doctors are really worried that people have been too scared to come to the hospital even if they experience a life threatening event such as a mild heart attack or a stroke. Many more may not be able to secure medications or have routine screenings which saves lives and elective surgery as the latter has been banned in many places. Some of these surgeries are life saving. There is real and significant mortality caused by sledgehammer government measures.
It's no wonder epidemiology is such an inexact science. That doesn't excuse however early papers that were later retracted or proven totally wrong or withholding of critical data by some governments.
David Young = whataboutism = propaganda /: = slanthead thinker
It instructive to look again at Sweden's death toll: still no clear evidence of a peak, weekly death rates much higher than neighbouring countries. Even stronger evidence than before that taking strong action make a big difference (obviously).
Also, watching people claim a peak every week has been amusing.
Unknown,
Exactly! I did it once, the peak that is, but no more. There is a rather strong weekly periodicity (currently in 4th week for the US and 5th week for SE and World-CN). I'll post some graphs (somewhere) COB Friday for all three.
Doubling time in days (3-, 5-, 7- and 9-day log-normal rolling OLS fits, kind of like LOWESS smooth), that has the weekly periodicity, a little bit rougher to see in the dailies for deaths.
In earlier posts you modelled secondary epidemics. Do you think the virus has been crushed? Is there anything in your model that gives you the insight?
Sweden has a peak every week.
RE: G Secondary epidemics depend on not having good enough contact tracing, testing and isolation. Keep R below 1.0, and no secondary epidemic.
NY has results of an antibody study. Perhaps large and careful enough to not be meaningless.
https://www.cnbc.com/2020/04/23/new-york-antibody-study-estimates-13point9percent-of-residents-have-had-the-coronavirus-cuomo-says.html
This probably overstates the fraction of the population with antibodies for a list of reasons. Testing was done on people shopping. Younger than average. Test has a significant false positive rate. Some factors understating fraction include people ill and dead are not tested.
The death rate reported is understated for another list of reasons. Not enough time for all deaths to occur. Many deaths in excess of background rate.
Raw answer is 0.76% death rate. Current deaths divided by antibody testing positive.
With all adjustments? I'd be surprised if under 1%.
A Tale of Two Cities …
https://live.staticflickr.com/65535/49816274808_05a8522463_b.jpg
The Bay area includes Santa Clara County + nine other per …
https://khn.org/news/is-the-bay-areas-unprecedented-lockdown-the-first-of-many/
The NYC Metro area is per …
https://en.wikipedia.org/wiki/New_York_metropolitan_area
It is somewhat of a no brainer that one can integrate doubling time to return to actual total accumulated deaths (although smoothed due to doubling time OLS log-normal fits of 3-, 5-, 7- and 9-day).
The Bay area 2010 census = 6,269,434 and The NYC Metro area 2010 census = 26,468,898.
As of COB 2020-04-24 the Bay area deaths = 158 and The NYC Metro area deaths = 27,306.
Like it or not, as James Annan states here is TRUE …
https://julesandjames.blogspot.com/2020/04/blueskiesresearchorguk-5-day-doubling.html
“A small corollary of the above, added on 21 Apr: It is very straightforward to calculate the effect of a delay to the lockdown. A week of unchecked growth at 3-day doubling corresponds to a factor of 5, meaning that 80% of the total size of the first wave we are currently in could be directly attributed to the Govt delaying by a week, if it was felt that the evidence could and should have supported action that much sooner (ie, when most of the rest of Europe was taking action). That means 80% of the peak strain on the NHS, 80% of total cases and also 80% of all resulting deaths. What this calculation doesn’t account for, is what happens in the longer term. We may all get it in the longer term anyway (well 60%+ of us). But we might not, and even so, the huge peak was 5x bigger than it would have been if controlled just a week quicker.”
Except NYC started with a doubling time of ~ONE DAY! IMHO tens of thousands of lives could have been saved if NYC lockdowns had started 2-3 weeks before their actual 2020-03-22 lockdown.
The Bay area lockdown was the 1st for the US starting on 2020-03-17 but they had not seen a death and confirmed was 168 (NYC Metro had 1117 confirmed and 12 deaths on that date, JHU data) cases on the 16th.
Oh and I tested negative for COVID-19 (hopefully just a bad cold).
Moral of this sad story, don’t listen to idiots that spew shit about ‘you can’t do that because we need definitive date 1st’ you know who I am talking about. Lockdowns are actually a very old strategy when shit hits the proverbial fan.
Stay home and stay safe! :)
Well, I see that David is one again cherry picking numbers and extrapolating from non-representative convenience sampling, so as to confirm his political biases and convince others his political views are correct.
Well, at least he's consistent. I'll give him that.
For Josh's benefit, serologic testing results are in for Miami Dade county. They tried to do a random sample so its perhaps the best data so far. Implied IFR is 0.13% to 0.23%. Total fatalities in the US if nearly everyone is infected is 390K to 690K. Ferguson from Imperial asserts that 2/3 of those would die within a year from pre-existing serious illnesses. Excess mortality is 130K to 230K for the next year. That places it about 4th or 5th on the causes of death list from NIH. Even if we multiply by 2 to account for future deaths of those already infected in Miami Dade, we get to 10% - 20% excess mortality. It's a large number, but not worth causing massive economic damage and excess mortality by denying access to health case screenings, "elective" procedures which often save lives too, massive unemployment, and massively increasing calls to suicide hot lines, etc. In retrospect this will be perhaps the biggest phony data driven "crisis" in US history.
This is probably a pretty good sample and confirms Ioannidis' work over the last 2 months. Shameful how he has been slandered by some of your resident anonymous teenagers James.
I tried to post this on another thread but it seems to have disappeared.
I would just point out for those demanding immediate "action" that there is a broad range of actions. One could advise those most at risk to take precautions which would have very little impact on economic activity since these people are already not employed and generally are not going out and buying lots of stuff. One could adopt the Swedish model which so far anyway has not proven inferior to say the UK. Swedish mortality per million is quite a bit lower than in the UK and their rate of increase isn't higher either. Their logarithmic curve is similar to most other European countries. There are also "smart lockdowns" such as locking down nursing homes where in NYC 1/3 of all fatalities have taken place.
Shutdown of all "nonessential" services is an extreme measure, perhaps that's why extremists favor it. Scaring people to death has its own collateral damage too and this episode has proven our media are truly more corrupt than even the yellow journalists of the Gilded Age. The real problem here (as all competent experts well know) is that a second wave is probably inevitable. It's happened with most past epidemics such as the Hong Kong flu when the second wave was worse than the first. Looking ahead beyond the next 2 weeks is something adults actually sometimes do. Accepting short term pain for long term gain is also a hallmark of adult human behavior.
David Young,
No one over here believes anything you say, not in all the yesterdays, not in all the todays and not in all the tomorrows.
Oh and Dr. Bad Combover is a media ho (to anyone else, please excuse my French) ...
http://med.stanford.edu/epidemiology-dept/covid19-responses.html
Miami-Dade imposed a lockdown on 2020-03-26. The 1st death occurred on 2020-03-27 (one day later) in that county ...
https://live.staticflickr.com/65535/49818808113_309284a573_b.jpg
"Testing for antibodies helps approximate the prevalence, or amount, of infection within our community at a given time.
Because the test relies on the level of antibody production in each individual’s blood, there is an 89 percent to 91 percent accuracy rate."
So ... at a given time! What ... only 90% accuracy rate!
Doubling times are not constant for either deaths or confirmed cases. The spread of the pandemic is changing over time, primarily due to the lockdown.
When one of these so-called studies occurs where there are no lockdowns, say three months after first death then you might be able to say something about population rates. That situation has not happened yet. /:
At best, you are only telling us the population rates under lockdown situations, where we expect lower numbers BECAUSE of the lockdown. D'oh!
How can any one individual be s-o-o-o-o-o-o-o-o fundamentally D-K infested.
The Coronavirus Isn’t Just the Flu, Bro
https://www.bloomberg.com/opinion/articles/2020-04-24/is-coronavirus-worse-than-the-flu-blood-studies-say-yes-by-far
"Results from recent blood tests show how widely the disease has spread, and they indicate that Covid-19 is many times deadlier than seasonal influenza."
Read the whole thing.
Experts demolish studies suggesting COVID-19 is no worse than flu
https://arstechnica.com/science/2020/04/experts-demolish-studies-suggesting-covid-19-is-no-worse-than-flu/
Authors of widely publicized antibody studies “owe us all an apology,” one expert says.
Read the whole thing.
I see the angry drill sargent NCO is back First he goes straight to the journalists at Bloomberg (whitewash China) News (who were instructed by Bloomberg himself to NOT cover him while continuing to dig up dirt on all the others) while calling top notch scientists insulting names. The best estimates of IFR are higher than those for the flu, perhaps a factor of 2 or 3. But the best estimates are 12 times lower than the WHO initial estimate and 50 times lower than the raw CFR from the disastrously wrong top line numbers every talking head is parroting. However, it may not be more deadly than the Hong Kong flu in the late 1960's. The flu without a vaccine is probably comparable to covid19. Of course flu vaccination rates vary vastly around the world.
The other very important fact is that healthy people under 65 years of age have a very very small chance of getting seriously ill. That was well known in January and offered the option of smart isolation of vulnerable populations instead of lockdowns.
I'll just deal with your final media cherry picked story since its obviously badly misleading. They quote Gelman that the Santa Clara study authors (there were many) owe us an apology. It's basically a complaint that inadequate information was provided. The article of course fail to quote what he said in the conclusion: i have no idea whether the study is right. They are the experts on serological testing not me.!!! Those who are ignorant of the basic science should perhaps be more cautious. And yellow journalists should avoid such obvious dishonesty.
Other than that you have said nothing Sarg except show that you are still feverish and tired and lashing out. Get some rest.
There are at least 10 datasets now that show pretty much the same thing. It looks like the Imperial IFR's may be too high by a factor of 2 or more. Further total excess mortality will be perhaps 10% of expected mortality even if we did nothing.
I don't see the logic of your under lockdown vs. not under lockdown idea. You provided zero evidence because it seems to be something serious scientists don't advance as an argument. The real issue is that even if lockdowns decrease Rt do they just spread out the peak while total fatalities remain constant or increase. I see a lot of evidence in US data that even draconian lockdowns don't reduce Rt much below 1 and that months of lockdown may be needed as in Washington state for example. Illinois is a good example.
What will be interesting with the Swedish data (the test subjects may feel differently) will be to see if mortality rates stay comparable to other badly hit European countries (of which the UK is one) or if it continues to get worse.
It will be useful to have an idea of how much effort is required to get R below one. At the moment, given that there hasn't been that much recent change in behaviour/policy, you would still expect R>1.
On the other hand, most other comparable countries 'peaked' some time ago and have R clearly less than 1.
New Zealand has a plausible route to a medium-term solution. Sweden, not so much.
Call center in South Korea.
https://wwwnc.cdc.gov/eid/article/26/8/20-1274-f2
There are not vast numbers of uncounted cases in this call center. Too many counted cases for that.
I see David Young, the compulsive culture warrior, is here bringing his fantasy fight to his imaginary enemies. I wonder how he sleeps at night, with the crowd of collectivist monsters under his bed.
I'm feeling better than I ever have. Wine cellar stocked with a 5 year supply of excellent wine. Life in general is great right now. I'm quite well adapted and just laugh at the content free childish lies and heckling by the mal adapted. My condolences to you. Getting a life can make you less angry and more charitable. :-). Also a good antidote to the mind reading over the internet disease.
"Content free"? Whatever can the virtual (although ostensibly masculine) identity calling himself "David Young" mean? His doggedly re-asserted "content" has been discussed to death, here and elsewhere, and found to be transparent lukewarmism. It's incorrigibly dedicated to highlighting uncertainties in climate and epidemiological models, as if to cast doubt on the whole modeling enterprise as a tool for collective decision-making. Now the content shifts to David Young himself! The question under discussion becomes: Why does he continue to post the same foolish content, long after it's been decisively debunked? We're not, in fact, mind readers, whether or not a virtual identity can be said to have a mind as such. Nor is mind reading required: our speculations are informed by the full content of all his blog interactions, ever. The Internet never forgets content! If, OTOH, David Young stops posting his false and misleading content, then we could get on with the content of James's post. Meanwhile, I have as much time as DY does.
I see your moniker is a dodo bird!! Is that your level of mental acquity? A content free ad hominem attack is still that no matter how many tines you repeat it.
What I have said here is true. Newer research of serologic testing shows that IFR's for covid19 are on the order of 0.12% to 0.46%. That's vastly lower than the top line numbers that are fraudulently shown on every news program. Total excess mortality will likely be 5% to 20% of normal annual mortality even if everyone gets infected. It's a large number but not higher than for numerous past pandemics such as the Hong Kong flu. This has phony data driven panic that will end up having huge costs for future generations.
What I've said about climate models is also transparently true and every expert knows it. Since numerical error levels are much higher than the outputs we need, any skill can only be due to tuning than causes large errors to cancel. There will be no expectation skill on other outputs.
Power law model for COVID-19:
https://phys.org/news/2020-04-covid-growth-universal-strategies.html
DY: I see your moniker is a dodo bird!! Is that your level of mental acquity?
And DY's mind is a blank. Yes, we can trade puerile gibes 'til death do us part. It might be fun! That's surely not what this blog is about, though. AFAICT, it's mainly about how science can help us anticipate the onrushing global climate calamity, or a lethal pandemic in this case. Scientists have their own motivations, but anyone who isn't fooling himself is interested in mitigating existential threats to human society and the biosphere.
DY: A content free ad hominem attack is still that no matter how many tines you repeat it.
Yes, and the content of my counter-attack is still DY's transparent effort to poison the well of science. That's convincingly revealed by his history on the blogosphere. By presenting his opinions as facts, refusing to accept correction from genuine experts, and demanding more certainty than science can provide, he makes himself the content of his own comments.
DY: Since numerical error levels are much higher than the outputs we need, any skill can only be due to tuning than causes large errors to cancel. There will be no expectation skill on other outputs.
DY confidently attributes any skill shown by a simulation of climate or pandemics to the modelers' fraudulent intent. IOW, he's convinced he's more expert on the behavior of the models than the trained specialists are. He's manifestly wrong about that, and we don't need mind-reading skills to recognize the Dunning-Kruger effect. Elsewhere he declares his wish that no "strong" collective action be taken against climate change, "a position that while unpopular with alarmists, does not imply 'denial' of any science." He follows that with "Policy is a matter of values and priorities, not science as Bertrand Russell convincingly argued. So, can we just dispense with the political smears?"
Yet here DY denies epidemiology, calling pandemic modelers alarmists and frauds. Clearly, regardless of its source, a numerical error level low enough for the rest of us isn't low enough for him. Never mind what we need: he'd rather take his chances with COVID-19 and the greenhouse effect, than agree to collective action against them. He has irrevocably shown us that his values are anti-collective, and opposing collective action his highest priority. His comments here have no other content.
Mal, You last comment is a compendium of errors and fallacies. In addition it has no scientific or medical content. It's really pretty childish and I think anyone reading this will see that clearly.
Everett F Sargent, Phil
...There is a rather strong weekly periodicity (currently in 4th week for the US and 5th week for SE and World-CN). I'll post some graphs (somewhere) COB Friday for all three.
The worldmeter data has strong periodicity. That might have something to do with a weekend effect in recording. The Swedes seem to later sort out actual death dates and post that here:
https://www.folkhalsomyndigheten.se/smittskydd-beredskap/utbrott/aktuella-utbrott/covid-19/bekraftade-fall-i-sverige
Warning: You absolutely should the final days of this record. The deaths are sorted and the final days change! I've been downloading every day and showing how the daily deaths change as more data are sorted. My guess is that daily deaths do drop after 4/17. But.. who knows? Maybe it's still just a lag in reporting.
Opps forgot the link to the figure
https://twitter.com/lucialiljegren/status/1255679411921223681
Sweden's death's per 1M on worldometer are not flash. Worse than US and far worse than their neighbours. Price they are willing to pay for their economy I guess. I prefer the NZ and Austalian approaches.
Boeing will cut 111 percent of workforce, says federal support “critical”
"We're in an unprecedented period for the industry and the world."
https://arstechnica.com/science/2020/04/boeing-will-cut-111-percent-of-workforce-says-federal-support-critical/
Five years of Thunderbird wine in five days or see the movie Leaving Se Attle. Vintage 2020-05-05, oh wait that is the drink by date.
More bad news for those who don't look before they leap (includes DY, Woy and well all deniers, in general) ...
https://www.euromomo.eu/bulletins/2020-17/
SE back to almost dark blue. They keep changing their y-axes to larger values so that 2020 data stays within the graphical bounds.
Same disclaimers for Weeks 15-17, as in, the data can only go up and/or out. Right now the COVID-19 spike sort of looks like the Washington Monument.
This paper just came to my attention and points out an important flaw in simple models. If some subgroup is much more susceptible or exposed at a higher rate, herd immunity can be reached when 20% are infected in the general population.
https://www.medrxiv.org/content/10.1101/2020.04.27.20081893v1
1-1/R0 only is correct with random movement and equal susceptibility.
Actual herd immunity can be higher or lower, depending on types of movements. Social butterflies are more likely to be first infected then immune. Hermits are unlikely to be either.
People's movements vary with time. A hermit taking a cruise, for example. Norovirus is very infectious, and most people have immunity due to past infection. But bring a bunch of people together that have not had it, like in school or a cruise, and an explosion of cases can happen.
I remember pointing this out ages ago, like a month or so. Thought it was on this blog, but can't find it.
To beat DY to the punch, I should add that dose response can lower the death rate. Measures that slow spread (masks, larger person to person distance, etc) will also reduce the average dose of virus that infects a given person. A lower dose of virus has a lower chance of a serious/fatal case, and a higher chance of immunity with few/no symptoms. At least with other virus types.
EuroMOMO Week 18 is out ...
https://www.euromomo.eu/graphs-and-maps
Same Washington Monument shape same last three weekly disclaimers. Still skewed highly towards the elderly (more age brackets this time).
Oh FFS I had comment notification switched off so have not seen any of this..will read.
David, that paper is nothing particularly new or important. The complex models already include this effect and it's a well-known bias in the simplest models but doesn't overturn anything significant. Eg I get 88% total infection when using Ferguson's parameters, he gets 81% with a stratified model. Big deal.
Graeme, there will definitely be a big second peak if we go back to behaving as before. Despite the desperate attempts of the denialists, all the coherent and competently-analysed data points to a total infection rate of the order 10% in the UK, meaning we are nowhere near herd immunity. Total mortality rate really is in the region of the 0.75% number I use.
Post a Comment