I don't know if this has been clearly discussed elsewhere, but the recent publication of a couple of papers on the topic gives me a good excuse to talk about it. The first is Gillett et al, in GRL a little while ago, and there's a new paper by Gareth Jones et al in press at JGR. Both appear to perform fairly conventional D&A analyses on CMIP5 models. I've been fairly critical of the conventional D&A approach in the past, primarily on the grounds that the null hypothesis of no anthropogenic influence is always false a priori (and therefore a failure to detect an anthropogenic influence is always a matter of insufficient data). These recent papers point to another, arguably more terminal, problem. Attribution will inevitably fail as the anthropogenic effect increases!
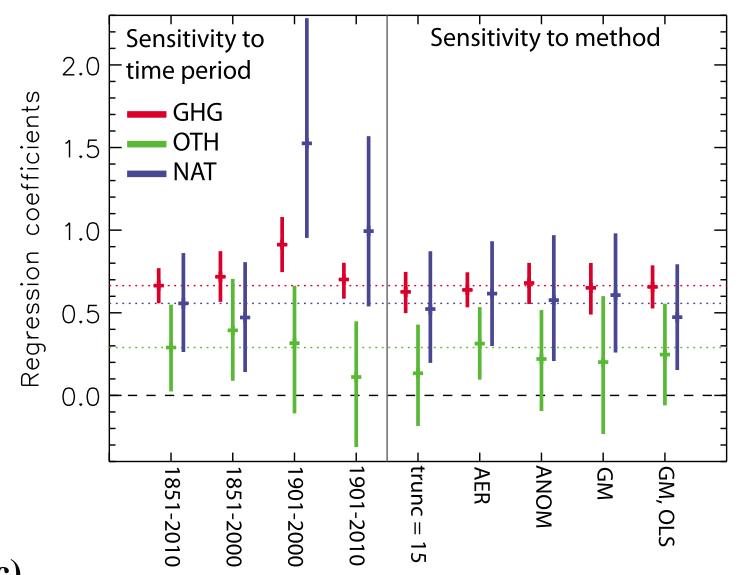
Gillett et al present their results primarily in terms of a better constrained estimate of the transient response. What they don't point out is that they cannot actually attribute the warming to anthropogenic forcing. As conventionally portrayed (eg by the IPCC here), attribution requires that the observed changes are consistent with the modelled estimate. However, the Gillett et al estimate of the scaling factor on the anthropogenic (GHG) component is about 0.7, with a confidence interval that clearly excludes 1. The figure below is the relevant one from their paper, and the critical point to note is that the left-most red coloured bar (which represents their main analysis) does not reach 1 on the y-axis. In fact the only way they can get a result which is consistent with the model is to limit their analysis to 100y of data. So, according to the standard definition their analysis simply cannot attribute the recent warming to GHGs.
Jones et al analyse a larger set of models, and for about half of them, the confidence interval on the estimated scaling factor includes 1. Don't blame me for the horrible picture below which is all that is available in their pre-production proof (hopefully the final version will be readable). Again, the central issue is whether the red bars on the figure include the value y=1. By my count, 9 of them do but 7 of them don't. (5 of the ones that do include 1, also include zero in the ranges of both G and OA, indicating a failure to detect an anthropogenic inflence at all. This voids any attempt at attribution a priori. However, I'm not so interested in that here.)

A moment's thought should confirm that failure to "attribute" in this sense will be an inevitable consequence of gathering a sufficiently long and precise time series of data. The actual value of the scaling factor - ie the ratio of real to modelled forced response - is never going to be precisely 1, for any model, any more than the actual value of the forced response is zero. All such hypotheses based on point estimates are inevitably false, and a failure to reject them only ever meant we didn't have enough data. But now it is increasingly the case that we do have enough data to reject many of the models. And this problem will only get worse as the data will surely keep pouring in at a rate greater than model improvement can keep up.
It will be interesting to see how the D&A community addresses this problem. Atribution of the observed changes to GHG and other influences was touted as a major step forward when it was first achieved, so it would surely be rather embarassing to lose the ability to do this. It looks a bit like they are trying to just ignore it for now, but that can't really be tenable as a long-term strategy.
16 comments:
On the Jones figure it looks like the GISS models broke their analysis. Has Gavin been dividing by zero again?
Just wondering what the other bars were. Is NAT natural variability? In any case, looks like models overestimate temp response
The split is into GHG, other anthropogenic (aerosols etc), and natural forcings like volcanic and solar.
Eli goes with "precise" data. Before 1900 it was anything but, so if you need long and precise and have anything pre 1900 you lose. Wrt ghg forcing, the variation was so small that correlations would not be very useful
Also it would be better to have a metric less lumpy than global anything, although of course that is going to mess up when the data is good enough to use even more. So agreed, this is on a hiding to nothing
Why is the scatter in the second plot so large? Was there a methodological problem?
David, these are scaling factors on lots of different models, it is to be expected that they will differ a lot. Some models overestinte the forcred respose, onthers underestimate it. (The top plot from Gillett et al presents minor methodolodical variations but all with a single model, hence they look more similar).
It is worth noting in response to Eli and other previous commenters that although the analyses are often presented in terms of global mean temperature, they actually use the spatial patterns arising from the different forcings. It's the land/ocean contrast and strong polar amplification that really shows the warming is not natural.
It sure looks to me like the models are way off on other anthropogenic forcings. I'm surprised at the better correlation for natural forcings. I thought models had little skill at internal variability
David, the Natural component includes volcanoes, which have a pretty clear signature in the record.
Interesting to compare the CanESM2 and CSIRO-Mk3.6 results since they have similar diagnosed 2xCO2 sensitivities (also the Jones attribution for CanESM2 looks quite different from Gillett's).
Jones et al. suggest that CanESM2 significantly overestimates the GHG response and I assume the <0 scaling for Other means they find non-GHG anthropogenic influence should be of opposite sign (i.e. warming). On the other, completely contradictory, hand they indicate that CSIRO-Mk3.6 underestimates the response of both GHGs and the strongly net cooling effects of Other. If they applied Gillett's TCR scaling method here it would presumably suggest something like 4ºC!
I can't help thinking part of the problem here is related to the increasing complexity of models. The latest generation now mostly include complete indirect aerosol effects, improved aerosol chemistry and transport, more complete complement of aerosol species, stratospheric and tropospheric Ozone, biogeochemical "Earth System" feedbacks.
I would anticipate all this makes the job of fingerprint detection much messier than in older models, so you get some strange results when trying to pick apart different influences.
Is there a way to put 'local error' bars around climate sensitivity or show very short transients?
Climate sensitivity seems a reassuring, sane, small, longterm number.
It always makes me think of an old joke I just saw someone quote:
It reminds me of the old Emo Phillips story, when he was stopped by the highway patrol.
Cop: “You were doing 80 – the speed limit here is 50 miles per hour”.
Emo: “But I wasn’t going to be out that long!”
One popular way to do short-term transients is a direct scaling of projections according to these attribution coefficients. That works for decadal time scale (maybe up to about 100y, it probably loses physical validity in the long term). In fact this is basically what Gillett did, though those results were only quoted for the 70y (TCR) time.
Just saw this today (open access) which reinforces the points I've been making for some time...that is, the future warming is likely to be towards the lower end of the model projections.
Heh, that new Stott et al. paper appears to be an application of what I was talking about in the comment above regarding the use of Gillett's scaling with Jones' attribution.
As anticipated it brings up some strange results. The CanESM2 analysis indicates there could be cooling over the next 40 years, even in the RCP8.5 scenario, while the 4K+ sensitivity CSIRO-Mk3.6 model is deemed not nearly sensitive enough. The upper-end of projected observationally-constrained warming from the latter is off the scale, probably about 3.5ºC by 2050.
I know I'm relatively ignorant about the science here, but I'm seeing you quoted all over the intertubes as supporting fake skepticism. Is there some way you can paraphrase this work in a way that makes it clear that you are working towards more clarity instead of providing fuel to the denial industry? In layman's terms, can you state your conclusion in a way that doesn't discredit everything done by climate scientists for the last century?
I understand about single points and have always wondered how a system as complex and chaotic as climate could be predicted, but I do understand that there is trouble ahead - that's pretty obvious to the uninformed. I think that regardless of how chaotic the systems are, there is a measurable influence overall in the larger trends.
By the way, my father, Philip W. Anderson, agrees with me, so I'm not just flying blind.
Susan, Science is science. James is stating things in scientific terms. I think personally there is a lot of crow to eat for the IPCC and lots of others who have stressed the most dire consequences and the highest estimates. All James is saying is that the highest estimates are very very unlikely. That's a very important point. Exactly what sensitivity is will I'm sure remain unsettled for a long while and may never be known with certainty, after all there is something called irreducible uncertainty. We can't even really define it in a way that's measurable.
In any case, extremists will always misrepresent science, whether it be those who you call "denialists" who really have little or no power or Green groups who have a great deal more power and money, or former politicians who like to make tons of money and own private jets. Get used to it. It's called free speech.
Further to David's comment, this particular post is focussing on a rather technical point, which certainly should be of some concern to people working in the area. It doesn't address the issue of how much we are changing the climate.
Dr. Annan's response:
"It doesn't address the issue of how much we are changing the climate." was exactly what I was fishing for.
In addition:
"although the analyses are often presented in terms of global mean temperature, they actually use the spatial patterns arising from the different forcings. It's the land/ocean contrast and strong polar amplification that really shows the warming is not natural."
The reason I came here is that dishonest exploitations of this work are the meme du jour and are normally organized; the source usually says something different than the claims about the source.
Whatever the cause, and however scientists measure it, consequences are piling up, but I am trespassing to say so here. As David Young says: "free speech, get used to it." His other opinions are not my business.
Post a Comment