It occurred to me that the talk of perhaps bringing in restrictions some time in the future was probably poorly timed, in that we are probably pretty close to the peak right now and if action is going to be worthwhile, it needs to be pretty much immediate. Having made a few comments to that end on twitter, I thought I should check out my intuition with some calculations. So here they are.
My starting point is that the Omicron variant represented 22% of tests on the 11th Dec (link) and we had about 40k positive tests on that day (link - but see additional note at bottom of post) meaning 9k tested cases which I will assume represents 18k real infections (ie 50% of infections are actually observed) and furthermore I'll assume that these infections happened on the 8th as it must take a little while to feel ill and get tested.
I'm using a doubling time of about 2 days with an underlying R0 number of 6, and another assumption I'm making is that the population is about 50% immune. I'm ignoring the Delta infection which is small in comparison and carries on largely in parallel with Omicron.
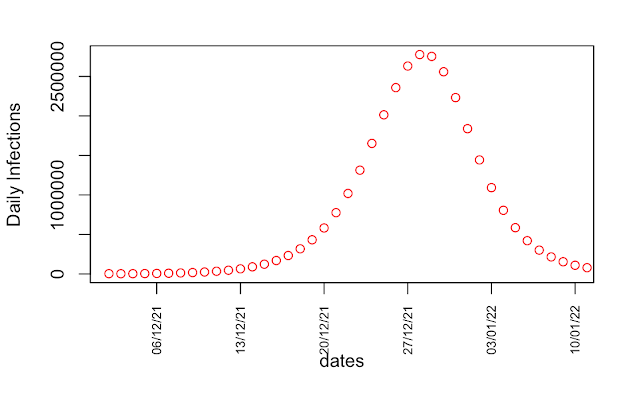
So I initialise the model to hit 18k infections on the 8th, and ran it forwards. This is what I get with no action at all, just the natural infection profile of an uncontrolled epidemic:
4 comments:
Since the govt has done very little, does this now amount to a prediction that your first plot applies? Or does the general quietening down towards Christmas count as a decrease in expected R?
Definitely looks like a bit of a slowdown, though it's hard to be certain that counting hasn't got harder....positivity rate in London has gone v high for example and data delays may also be growing. But certainly some people have changed their behaviour.
As your first plot seems to be an order of magnitude too high, I'm wondering which assumption needs to be changed. Both?
I also note Francois Balloux on the BBC website suggesting London has already passed the peak and the rest of the country is soon to follow.
If the death rate doesn't rise any more than it did in South Africa, perhaps we should consider Omicron infections as vaccination events, and a way to help the vaccine-hesitant?
The latest ONS says 2.8% average positivity over the week 13-19th Dec, which is a huge increase on their previous number. If I sum up my infections for the 12 days 6-17th I get 1.7% of the population infected in that window - which plausibly translates to positive in the relevant window.
I don't think it is that clear that my graphs are an order of magnitude wrong. I would agree it looks like things have probably flattened off a bit. I think it's possible that testing is showing an optimistic picture for a number of reasons.
Post a Comment