BlueSkiesResearch.org.uk |
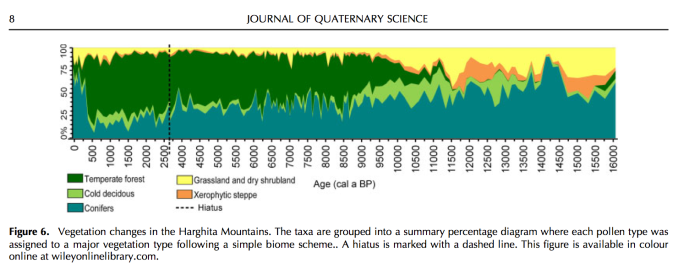
| Posted: 21 Feb 2014 10:30 AM PST I usually get lost in the wiggles and weird nomenclature of paleoclimate data papers and presentations. Most seem to require some magic eye or inner sight, that I am sadly not gifted with, to see the climate signal. All I usually see is “noise”. This figure, however, is beautifully informative to this non-expert of paleo-data. Perhaps such figures are old hat. I probably need to get less tl;dr. Even for this one, you have to get through 7 pages of weird wiggles before it appears, on page 8 of the 12 page paper.
TANŢĂU, I., FEURDEAN, A., DE BEAULIEU, J.-L., REILLE, M. and FĂRCAŞ, S.: Vegetation sensitivity to climate changes and human impact in the Harghita Mountains (Eastern Romanian Carpathians) over the past 15 000 years, J. Quaternary Sci., n/a–n/a, doi:10.1002/jqs.2688, 2014. jules |

No comments:
Post a Comment